Historical Weather Data APS
The example Python source code is meant merely as a starting point to quickly interact and retrieve insights from ADMA. It is in no way intended for production workloads.
Historical Weather Data
Once you have successfully created a Party and Farm, you can use the Historical Weather service to pull historical
weather data.
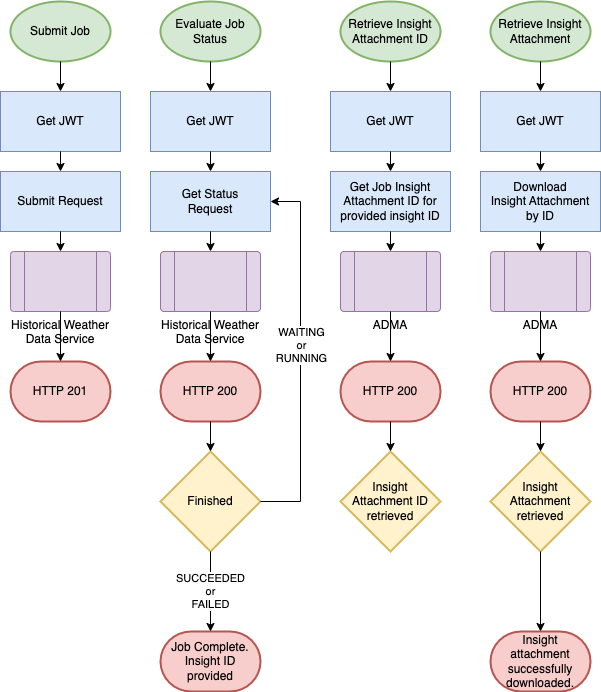
This is a four-step process due to the asynchronous nature of the service. These four steps have
been captured and automated in tutorial/example/historical_weather.py
included in the downloadable tutorial zipfile.

- Submit a job request for a specific
Party,Field, and inclusive Start and End years. The JSON for the request looks like the following. Note that in this caseresourceIdis thefieldIdas indicated by theresourceType.
{
  "requestPath": "/v1/historical-weather-data/job-name-1",
  "partnerRequestBody": {
    "interval": "daily",
    "partyId": "party1",
    "jobs": [
      {
        "resourceType": "Field",
        "resourceId": "field1",
        "weatherStartDate": "2023-01-01",
        "weatherEndDate": "2023-02-01",
        "temperatureUnit": "C"
      }
    ]
  }
}
- Poll for the status of the job until the status of the job is
SUCCEEDED. - Use the insightId included in the successful status response to retrieve the insight attachment ID.
- Use the retrieved insight Attachment ID to download the attachment containing the predictions for all years.
Before we execute the tutorial command that wraps these steps, a little explanation is in order.
A new directory will be created in the root of
the adma directory named output. Within the output directory, the following directory structure will be
created: party_id/resource_id/solution_id. This directory will hold log files of submitted requests and
subsequent responses. In the following example the log file is named 2023-01-01-5617cf3e-a17f-417f-8ef5-aef4a81c9294.txt. This directory
will also hold the generated historical weather insight JSON and CSV file.
Output Directory Structure
output
└── 551c7fb3-8b9c-4b5c-8ecc-d6830325ce12
    └── b159f824-4d12-4b40-aa38-b98f0c876edf
        └── bayerAgPowered.historicalWeather
            ├── 2023-01-01-5617cf3e-a17f-417f-8ef5-aef4a81c9294.txt
            ├── 2023-01-01-5617cf3e-a17f-417f-8ef5-aef4a81c9294-b5038030-9074-4a77-a974-c6874bc0026c.json
            └── 2023-01-01-5617cf3e-a17f-417f-8ef5-aef4a81c9294-d7561838-7d30-4777-88da-d7c8600fb588.csv
A sample output from this example may be downloaded as hw-output.
E.g.
avgAtmosPressure,avgDewPointTemperature,avgSoilMoisture,avgSoilTemperature,avgSnowDepth,avgWindSpeed,maxAtmosPressure,maxDewPointTemperature,maxDownwardSolarRadiation,maxNetSolarRadiation,maxSoilTemperature,maxTemp,maxWindSpeed,minAtmosPressure,minDewPointTemperature,minSoilTemperature,minTemp,minWindSpeed,totalCloudCover,totalDownwardSolarRadiation,totalNetSolarRadiation,totalPrecipitation,weatherDate
988.70,-1.99,0.50,-0.25,0.02,13.57,996.65,3.10,0.27,0.19,-0.22,4.50,18.70,981.42,-5.00,-0.32,-3.30,10.40,0.23,0.93,0.64,0.02,2023-01-01
1002.73,-4.34,0.49,-0.34,0.02,9.35,1005.82,-2.50,0.28,0.19,-0.22,-1.70,16.90,997.51,-5.90,-0.44,-5.90,2.50,0.42,0.93,0.64,1.70,2023-01-02
998.31,-3.85,0.48,-0.32,0.02,10.14,1004.29,-2.60,0.22,0.15,-0.11,-1.50,13.70,993.72,-5.80,-0.46,-3.80,4.00,1.00,0.71,0.49,2.57,2023-01-03
1005.60,-7.23,0.48,-0.54,0.03,8.61,1006.86,-4.20,0.16,0.11,-0.11,-3.50,13.00,1004.18,-12.90,-1.68,-11.70,3.20,0.97,0.55,0.38,0.96,2023-01-04
1006.72,-12.97,0.48,-3.13,0.03,9.41,1013.06,-11.10,0.29,0.20,-1.49,-8.70,13.30,1003.35,-14.40,-4.32,-13.00,5.80,0.66,0.99,0.68,0.07,2023-01-05
Generate a Historical Weather insight
Note that you will need to replace the party_id and farm_id "REPLACE_ME" values
with your own party_id and farm_id in tutorial/example/historical_weather.py to generate and
retrieve the insight and its attachment.
python -m tutorial.example.historical_weather